Micro Lesson #2
MICRO LESSON #2
1. RATIONALE:
This lesson is closely tied to the Arizona State Standards for Mathematics, English Language Arts, and the ISTE Standards for Students. Students will be learning about scaled bar graphs, answering questions about scaled bar graphs, and creating their own scaled bar graphs. Students will be engaged in individual work, small group, and whole class discussion. This lesson is very relevant to their learning since they are learning about analyzing and interpreting data, which is an important mathematical skill.
2. OVERVIEW:
Grade Level: 3rd Grade
Subject(s): Math and technology
Topic of Study: Creating Scaled Bar Graphs
Time Allotment: 30 minutes
Standards:
- 3.MD.B. Create a scaled picture graph and a scaled bar graph to represent data with several categories. Solve one and two-step "how many more" and "how many less" problems using information presented in scaled bar graphs.
- NOTE: For this lesson I will be focusing on scaled bar graphs and solving "how many more" and "how many less" questions for scaled bar graphs. I would use this standard in a unit and also incorporate another lesson similar to scaled picture graphs. However, for the purpose of this lesson, I will only be focusing on scaled bar graphs.
- 3.W.6. With guidance and support from adults, use technology to produce and publish writing (using keyboarding skills) as well as to interact and collaborate with others.
- ISTE Creative Communicator
- 6.b. Students create original works or responsibly repurpose or remix digital resources into new creations.
Objectives:
- Students will be able to design a scaled bar graph that accurately represents the data set from their class survey questions.
- Students will be able to analyze data found from a scaled bar graph to solve one and two step "how many more" and "how many less" problems.
- Students will be able to create one and two step "how many more" and "how many less" problems based on the scaled bar graph they created.
3. IMPLEMENTATION
***Prior to this lesson, students will have already discussed the difference between single-unit scaled bar graphs and multi-unit scaled bar graphs. We have defined both terms as a class and practiced analyzing data from a bar graph to answer questions. Students have also taken a survey as a class, and will be using the data from their classes survey to create their own graphs. However, this was done before this lesson. This lesson is also part of a bigger unit involving scaled picture graphs. ***
1.) Students will get into groups of 3-4 and work on a quick sort for single-unit scale and multi-unit scaled bar graphs. The teacher will walk around each group and check their work, asking probing questions. Quickly, as a class, students will have a chance to go over the bar graph sort and review what makes a bar graph scaled.
2.) Then students will get out their Chromebooks and log on using their passwords/credentials (depends on school).
3.) The instructions handout and grading rubric will be passed out to students, outlining what they are to do for the following activity. Students will be given a link to a google form, which they will be following for most of this activity. First, they will be answering "how many more" and "how many less" questions about a scaled bar graph that I have created from a set of data from the class survey.
4.) Then, they will be given their own set of data from a question asked in the survey and making their own scaled bar graph from that data. Once they are done creating their graph, they will email it to the teachers email address that is listed in the google form. Thinking about the graph the students just made, they will create one "how many more" question and one "how many less" question that correlates to their graph.
5.) The teacher will be walking around assisting students with their work throughout this lesson.
6.) Once students have completed all the questions in the google form, they are done. If they finish before others, I will challenge them with making more questions for their graph or making another bar graph.
7.) An extension for this lesson, is having students switch bar graphs with another classmate and have students try to solve their classmates questions for their graph.
4. ASSESSMENT
Grading Checklist:
1. You were able to solve a...
- one step "how many more" problem based on data found from a scaled bar graph _______/1
- one step "how many less" problem based on data found from a scaled bar graph _______/1
- two step "how many more" problem based on data found from a scaled bar graph _______/1
- two step "how many less" problem based on data found from a scaled bar graph _______/1
2. You created a scaled bar graph that is accurate to your data from the class survey. _______/5
3. Your scaled bar graph is scaled, has a title, and a labeled x axis and y axis. _______/5
4. 2 problems were created based on your scaled bar graph that asks...
- 1 "how many more" question _______/2
- 1 "how many less" question _______/2
5. The 2 problems you created were typed into the Google Form for the class. _______/2
Total: __________/20
Comments:
5. MATERIALS AND RESOURCES
Bar Graph Website: https://nces.ed.gov/nceskids/createagraph/default.aspx
Google Form: https://goo.gl/forms/KGFxhn6lj64kSxog1
Single-Unit and Multi-Unit Scaled Bar Graph sort:
*Print, cut out graphs, and make enough copies for 8-10 groups*


Instructions:

Google Form: https://goo.gl/forms/KGFxhn6lj64kSxog1
Single-Unit and Multi-Unit Scaled Bar Graph sort:
*Print, cut out graphs, and make enough copies for 8-10 groups*
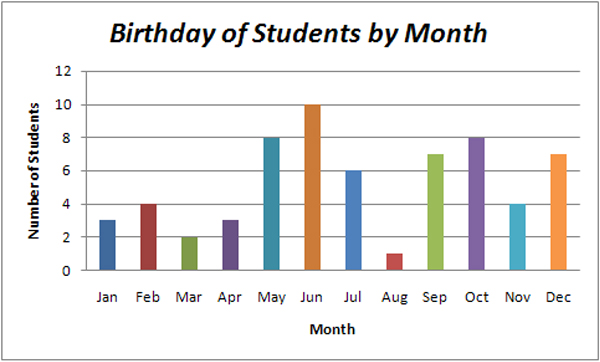
MULTI-UNIT SCALED BAR GRAPHS
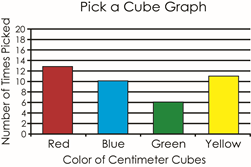
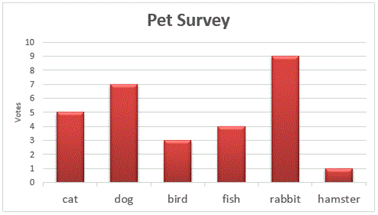
SINGLE-UNIT SCALE BAR GRAPHS
Instructions:
MAKE YOUR OWN SCALED BAR GRAPH
1. ) Go to this website: https://goo.gl/forms/KGFxhn6lj64kSxog1
2.) Follow the instructions in the google form! You will be answering a few questions about a graph that I have created about our class survey.
3.) Next, you will go to this website: https://nces.ed.gov/nceskids/createagraph/default.aspx
4.) Play around with the website! Click on "bar" to create your bar graph, once you have your data! You will need to click on the tabs on the right side of the screen to make your bar graph!
5.) Once you are happy with your graph and it has completed the requirements, click the "print/save" tab to email it to your teachers email address. Send it to: ajh489@nau.edu
Make sure you have a title and the labels for your graph before you send it!
6.) Once you send in your graph, create one "how many more" problem and one "how many less" problem to go with your graph.
EX: How many more students _______________?
How many less students ________________?
Grading Checklist:
1. You were able to solve a...
- one step "how many more" problem based on data found from a scaled bar graph _______/1
- one step "how many less" problem based on data found from a scaled bar graph _______/1
- two step "how many more" problem based on data found from a scaled bar graph _______/1
- two step "how many less" problem based on data found from a scaled bar graph _______/1
2. You created a scaled bar graph that is accurate to your data from the class survey. _______/5
3. Your scaled bar graph is scaled, has a title, and a labeled x axis and y axis. _______/5
4. 2 problems were created based on your scaled bar graph that asks...
- 1 "how many more" question _______/2
- 1 "how many less" question _______/2
5. The 2 problems you created were typed into the Google Form for the class. _______/2
Total: __________/20
Comments:
Sample Survey Questions and Answers:
Sample Survey Questions and Answers:
What do you want to be when you grow up?
teacher
|
Police officer
|
chef
|
teacher
|
nurse
|
scientist
|
teacher
|
scientist
|
teacher
|
nurse
|
chef
|
teacher
|
scientist
|
scientist
|
nurse
|
chef
|
teacher
|
nurse
|
Police officer
|
teacher
|
scientist
|
teacher
|
Police officer
|
scientist
|
teacher
|
chef
|
scientist
|
nurse
|
Which state were you born in?
Arizona
|
California
|
Utah
|
Arizona
|
Utah
|
California
|
Arizona
|
Florida
|
Arizona
|
Wisconsin
|
California
|
Florida
|
Arizona
|
Florida
|
California
|
Utah
|
Arizona
|
California
|
Arizona
|
Utah
|
California
|
Wisconsin
|
Arizona
|
California
|
Arizona
|
California
|
Arizona
|
Utah
|
What is your favorite hobby?
reading
|
sports
|
sports
|
Watching tv
|
Video games
|
sports
|
reading
|
Playing outside
|
reading
|
Video games
|
Video games
|
sports
|
Playing outside
|
sports
|
reading
|
Video games
|
Video games
|
sports
|
Playing outside
|
Video games
|
Video games
|
sports
|
reading
|
Video games
|
Watching tv
|
sports
|
Video games
|
reading
|
What kind of pet do you have?
None
|
Lizard
|
Cat
|
Cat
|
Dog
|
None
|
Cat
|
Dog
|
None
|
Dog
|
None
|
Dog
|
Lizard
|
None
|
None
|
Lizard
|
Dog
|
Bird
|
Dog
|
None
|
Cat
|
Cat
|
None
|
Dog
|
Lizard
|
Dog
|
Lizard
|
None
|
What is your favorite season?
summer
|
winter
|
spring
|
Fall
|
spring
|
winter
|
Summer
|
winter
|
summer
|
fall
|
winter
|
fall
|
summer
|
fall
|
summer
|
fall
|
winter
|
fall
|
winter
|
fall
|
summer
|
spring
|
fall
|
winter
|
summer
|
fall
|
winter
|
spring
|
What is your favorite kind of ice cream?
Mint chocolate chip
|
Chocolate
|
Cookie dough
|
chocolate
|
vanilla
|
Cookie dough
|
Mint chocolate chip
|
vanilla
|
Cookie dough
|
Mint chocolate chip
|
Cookie dough
|
Rocky road
|
chocolate
|
chocolate
|
Rocky road
|
chocolate
|
Vanilla
|
chocolate
|
Mint chocolate chip
|
Cookie dough
|
vanilla
|
Mint chocolate chip
|
vanilla
|
Cookie dough
|
chocolate
|
Rocky road
|
vanilla
|
Mint chocolate chip
|
Comments
Post a Comment